MSPowerBI: Difference between revisions
| (110 intermediate revisions by the same user not shown) | |||
| Line 3: | Line 3: | ||
===Concepts=== | ===Concepts=== | ||
* There are three different options on how your data should be treated: Import, DirectQuery, or Live Connection. This section will focus specifically on the Import option. | * What is [https://learn.microsoft.com/en-us/power-bi/fundamentals/power-bi-overview Power BI] | ||
* https://docs.microsoft.com/de-de/power-bi/guidance/star-schema | |||
* There are three different options on how your data should be treated: Import, DirectQuery, or Live Connection. This section will focus specifically on the Import option. | |||
=== | ====Relationsships==== | ||
Import aspects are: | |||
** | * Auto-detected relationships | ||
** | * There may be only one active relationship between two tables | ||
** | * There may be an unlimited number of in-active relationships between two tables | ||
* Relationships may only be built on a single column, not multiple columns | |||
* Relationships automatically filter from the one side of the relationship to the many side Relationships cannot be built directly between tables that have a many-to-many relationship | |||
* Cross-Filtering means a filter from a 1-to-many and many-to-1 relationship like filter on one dimension table to filter another dimension table via a fact table | |||
== | The arrows defines the direction of filtering: | ||
* | =====Hierachies===== | ||
* | * https://radacad.com/what-a-power-bi-hierarchy-is-and-how-to-use-it | ||
======Modelling Organizational Hierachies====== | |||
* https://ssbi-blog.de/blog/business-topics/wie-du-unregelmaessige-hierarchien-in-power-bi-und-power-pivot-nutzen-solltest/ fixed number of levels | |||
* https://www.daxpatterns.com/parent-child-hierarchies/ | |||
* https://radacad.com/parsing-organizational-hierarchy-or-chart-of-accounts-in-power-bi-with-parent-child-functions-in-dax with two columns representing a parent relationship | |||
* https://radacad.com/removing-blanks-from-organizational-ragged-hierarchy-in-power-bi-matrix-visual | |||
* https://radacad.com/dynamic-row-level-security-with-organizational-hierarchy-power-bi | |||
====Calculated Columns==== | |||
* [[File:PowerBI_28.PNG|50px]] | |||
ES Activity Order = RELATED('ES Activity Order'[ES Activity Order]) | |||
====Measures==== | |||
=====DAX Studio===== | |||
* https://towardsdatascience.com/handling-blank-in-power-bi-90eed948d042 | |||
==Operation== | ==Operation== | ||
| Line 22: | Line 43: | ||
Power Query Editor always works with a preview of the data, to make the development process fast. When you load the data in Power BI, transformations will be applied on the entire dataset. Hence errors might have not been identified before the full import of data. | Power Query Editor always works with a preview of the data, to make the development process fast. When you load the data in Power BI, transformations will be applied on the entire dataset. Hence errors might have not been identified before the full import of data. | ||
===Steps=== | |||
====Steps==== | |||
=====Define Import===== | |||
* select import and file | * select import and file | ||
* select transform (not load) | * select transform (not load) | ||
=====Delete Rows e.g. Header===== | |||
* delete rows above headers (e.g. filter sums) by [[File:PowerBI_3.PNG|400px]] | * delete rows above headers (e.g. filter sums) by [[File:PowerBI_3.PNG|400px]] | ||
* set first row as header line by [[File:PowerBI_4.PNG|400px]] | * set first row as header line by [[File:PowerBI_4.PNG|400px]] | ||
* | =====Add Columns===== | ||
* see https://docs.microsoft.com/de-de/power-bi/transform-model/desktop-tutorial-create-calculated-columns | |||
* [[File:PowerBI_11.PNG|400px]] | |||
* example [[File:PowerBI_12.PNG|400px]] | |||
<code>= Table.AddColumn(#"Geänderter Typ", "Charge Fact", each if Value.Is([#"Chargeability (FTE)#(lf)"], type number) then [#"Chargeability (FTE)#(lf)"] else 1)</code> | |||
<code>= Table.AddColumn(#"Geänderter Typ2", "Activity Type", each if [#"Partner-PSP-Element"] = "9914.P10048.004" then "ES Admin" else if [#"Partner-PSP-Element"] = "9914.P10048.005" then "ES Training" else if [#"Partner-PSP-Element"] = "9914.P10048.006" then "ES Relationship Management" else "tbd")</code> | |||
<code>= Table.AddColumn(#"Renamed Columns1", "Initials", each Text.Start([First Name], 1) & Text.Start([Last Name], 1))</code> | |||
=====Delete Rows===== | |||
* filter specific value (click to right down arrow in the column header and define the filter) | * filter specific value (click to right down arrow in the column header and define the filter) | ||
====N charactors from left==== | =====N charactors from left===== | ||
* [[File:PowerBI_7.PNG|200px]] | * [[File:PowerBI_7.PNG|200px]] | ||
* next step delete the rows to the right | * next step delete the rows to the right | ||
* rename column to the original name (w/o .1 suffix) | * rename column to the original name (w/o .1 suffix) | ||
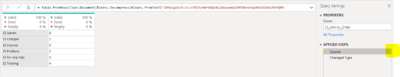
====Adjust Query==== | =====Adjust Query===== | ||
* Show Query Settings [[:File:Screenshot 2024-04-21 151120.png]] | |||
* [[File:PowerBI_6.PNG|100px]] | * [[File:PowerBI_6.PNG|100px]] | ||
====Not summing up a column like personnel number==== | =====Not summing up a column like personnel number===== | ||
* [[File:PowerBI_10.PNG|400px]] | * [[File:PowerBI_10.PNG|400px]] | ||
====Error Handling==== | =====Error Handling===== | ||
* [https://radacad.com/exception-reporting-in-power-bi-catch-the-error-rows-in-power-query example see here] | * [https://radacad.com/exception-reporting-in-power-bi-catch-the-error-rows-in-power-query example see here] | ||
* remove all rows with an error in one column [[File:Screenshot 2024-04-22 143455.png|400px]] [[File:Screenshot 2024-04-22 143615.png|400px]] | |||
* remove all rows with an error in any column [[File:Screenshot 2024-04-22 143919.png|400px]] | |||
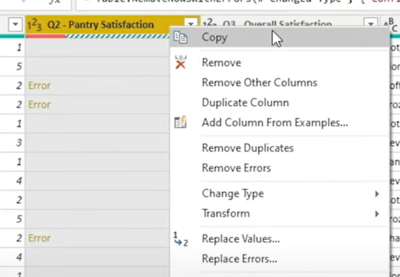
* replace errors in one column -> Replace Errors [[File:Screenshot 2024-04-22 144133.png|400px]] | |||
===Export Data to Excel=== | ===Export Data to Excel=== | ||
| Line 47: | Line 87: | ||
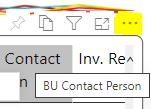
* select dots [[File:PowerBI_0.JPG|400px]] | * select dots [[File:PowerBI_0.JPG|400px]] | ||
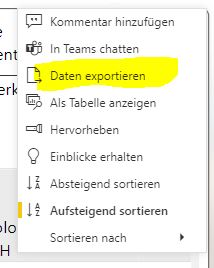
* select export data [[File:PowerBI_1.JPG|400px]] | * select export data [[File:PowerBI_1.JPG|400px]] | ||
===Relationsships=== | |||
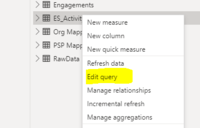
====Change Default Summarization==== | |||
* [[File:PowerBI_18.PNG|600px]] | |||
===Visuals=== | ===Visuals=== | ||
====General Properties==== | |||
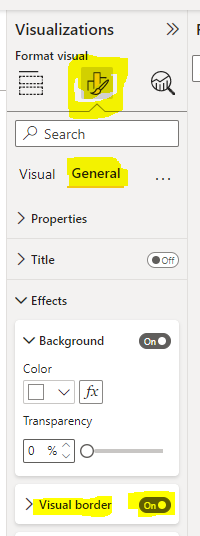
* border [[File:PowerBI_31.PNG|200px]] | |||
====Filter on Visuals==== | |||
* https://www.youtube.com/watch?v=8y4yjPYe4-8 | |||
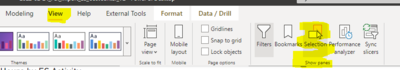
====Show Selection Pane for Grouping==== | |||
* [[File:PowerBI_19.PNG|400px]] | |||
* you need to select at least 2 visuals to have the context menu 'group' | |||
* to avoid overlapping visuals put them in different groups | |||
====Sorting according to Values==== | |||
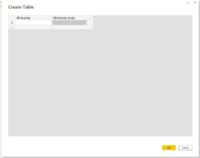
* Enter Data and give the table a name [[File:PowerBI_14.PNG|200px]] | |||
** if needed edit the data by [[File:PowerBI_15.PNG|200px]] which opens Power Query | |||
** select [[File:PowerBI_16.PNG|400px]] | |||
** creating columns and enter data | |||
* Create Relationship | |||
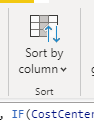
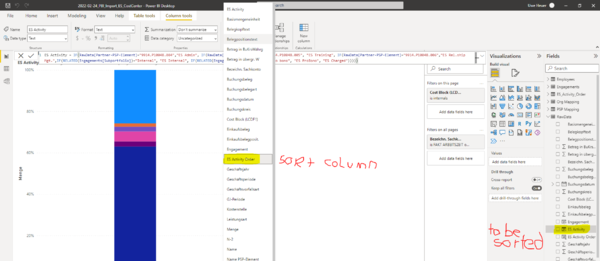
* Create new Sort Column with e.g. [[File:PowerBI_25.PNG|200px]] | |||
ES Activity Order = RELATED(ES_Activity_Order[ES Activity Order]) | |||
* set this column as sort column by [[File:PowerBI_26.PNG|100px]] [[File:PowerBI_17.PNG|600px]] | |||
====Slicer==== | ====Slicer==== | ||
* [[File:PowerBI_8.PNG|40px]] | * [[File:PowerBI_8.PNG|40px]] | ||
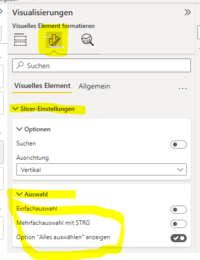
* Selection Behavior [[File:PowerBI_9.PNG|200px]] | * Selection Behavior [[File:PowerBI_9.PNG|200px]] | ||
====Matrix==== | |||
* is neary the same as pivot | |||
* https://www.goodly.co.in/create-pivot-table-in-power-bi/ | |||
* grand total and subtotals [[File:PowerBI_13.PNG|200px]] | |||
====Mulit-Row Card==== | |||
* Title On/Off: caption of multi-row card on top | |||
* Visual Data -> Fields -> Right Click -> Rename for this visual: text below number | |||
* Visual Data -> Category Label On/Off: show text below number | |||
* Visual Data -> Category Label: format of text below number | |||
====Pie Chart==== | |||
* sequence of fields defines the position, starts at 00:00 | |||
* Format -> Visual -> Legend -> Position | |||
* Format -> Visual -> Slices -> Colors [[File:PowerBI_30.PNG|100px]] | |||
====Single Card==== | |||
* 'Collout value' -> Font: size of number | |||
* 'Category label' on/off: text below number | |||
* 'Title': text above number | |||
====Stacked Bar Chart==== | |||
* figures in bar by switching on 'data label' | |||
* bar char width by spacing -> Inner Padding[[File:PowerBI_22.PNG|200px]] | |||
* colors [[File:PowerBI_27.PNG|200px]] | |||
====100% Stacked Column Chart==== | |||
* zoom slider [[File:PowerBI_23.PNG|200px]] [[File:PowerBI_24.PNG|50px]] | |||
====Stacked Column Chart==== | |||
* show 0 values | |||
=====Table===== | |||
=====Show Duplicates===== | |||
* https://www.goodly.co.in/find-duplicate-values-dimension-table-powerbi/ | |||
* [[File:PowerBI_21.PNG|400px]] | |||
==Projects== | |||
===ES KPI Reporting=== | |||
* Table for Activity Sorting: Report View -> Enter Data -> ... and edit it via [https://radacad.com/create-a-table-in-power-bi-using-enter-data-and-how-to-edit-it these] steps | |||
==English/German== | ==English/German== | ||
Latest revision as of 10:26, 3 September 2024
Information[edit]
- extension for local saves is *.pbix
Concepts[edit]
- What is Power BI
- https://docs.microsoft.com/de-de/power-bi/guidance/star-schema
- There are three different options on how your data should be treated: Import, DirectQuery, or Live Connection. This section will focus specifically on the Import option.
Relationsships[edit]
Import aspects are:
- Auto-detected relationships
- There may be only one active relationship between two tables
- There may be an unlimited number of in-active relationships between two tables
- Relationships may only be built on a single column, not multiple columns
- Relationships automatically filter from the one side of the relationship to the many side Relationships cannot be built directly between tables that have a many-to-many relationship
- Cross-Filtering means a filter from a 1-to-many and many-to-1 relationship like filter on one dimension table to filter another dimension table via a fact table
The arrows defines the direction of filtering:
Hierachies[edit]
Modelling Organizational Hierachies[edit]
- https://ssbi-blog.de/blog/business-topics/wie-du-unregelmaessige-hierarchien-in-power-bi-und-power-pivot-nutzen-solltest/ fixed number of levels
- https://www.daxpatterns.com/parent-child-hierarchies/
- https://radacad.com/parsing-organizational-hierarchy-or-chart-of-accounts-in-power-bi-with-parent-child-functions-in-dax with two columns representing a parent relationship
- https://radacad.com/removing-blanks-from-organizational-ragged-hierarchy-in-power-bi-matrix-visual
- https://radacad.com/dynamic-row-level-security-with-organizational-hierarchy-power-bi
Calculated Columns[edit]
ES Activity Order = RELATED('ES Activity Order'[ES Activity Order])
Measures[edit]
DAX Studio[edit]
Operation[edit]
Import Data from Excel[edit]
General Information[edit]
Power Query Editor always works with a preview of the data, to make the development process fast. When you load the data in Power BI, transformations will be applied on the entire dataset. Hence errors might have not been identified before the full import of data.
Steps[edit]
Define Import[edit]
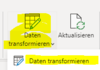
- select import and file
- select transform (not load)
Delete Rows e.g. Header[edit]
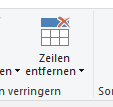
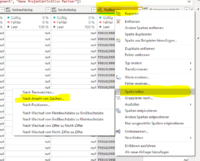
- delete rows above headers (e.g. filter sums) by
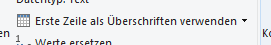
- set first row as header line by


Add Columns[edit]
- see https://docs.microsoft.com/de-de/power-bi/transform-model/desktop-tutorial-create-calculated-columns
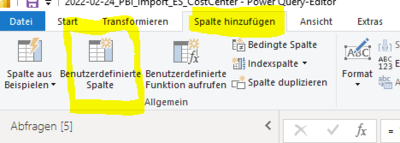
- example
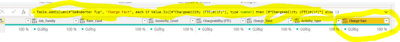

= Table.AddColumn(#"Geänderter Typ", "Charge Fact", each if Value.Is([#"Chargeability (FTE)#(lf)"], type number) then [#"Chargeability (FTE)#(lf)"] else 1)
= Table.AddColumn(#"Geänderter Typ2", "Activity Type", each if [#"Partner-PSP-Element"] = "9914.P10048.004" then "ES Admin" else if [#"Partner-PSP-Element"] = "9914.P10048.005" then "ES Training" else if [#"Partner-PSP-Element"] = "9914.P10048.006" then "ES Relationship Management" else "tbd")
= Table.AddColumn(#"Renamed Columns1", "Initials", each Text.Start([First Name], 1) & Text.Start([Last Name], 1))
Delete Rows[edit]
- filter specific value (click to right down arrow in the column header and define the filter)
N charactors from left[edit]
- next step delete the rows to the right
- rename column to the original name (w/o .1 suffix)

Adjust Query[edit]
- Show Query Settings File:Screenshot 2024-04-21 151120.png

Not summing up a column like personnel number[edit]

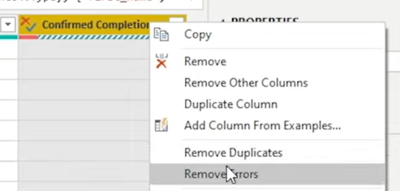
Error Handling[edit]
- example see here
- remove all rows with an error in one column

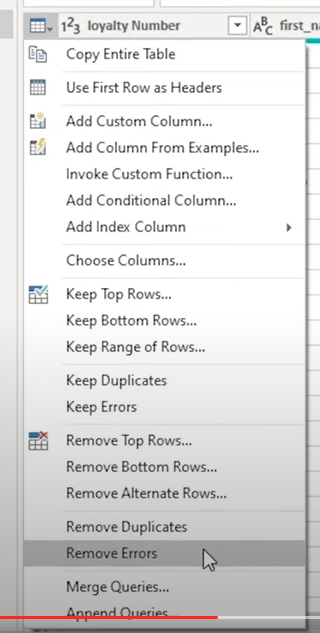
- remove all rows with an error in any column
- replace errors in one column -> Replace Errors


Export Data to Excel[edit]
- move or right click in header
- select dots
- select export data


Relationsships[edit]
Change Default Summarization[edit]

Visuals[edit]
General Properties[edit]
- border

Filter on Visuals[edit]
Show Selection Pane for Grouping[edit]
- you need to select at least 2 visuals to have the context menu 'group'
- to avoid overlapping visuals put them in different groups

Sorting according to Values[edit]
- Enter Data and give the table a name
- if needed edit the data by
 which opens Power Query
 - select
- creating columns and enter data
- if needed edit the data by
- Create Relationship
- Create new Sort Column with e.g.


ES Activity Order = RELATED(ES_Activity_Order[ES Activity Order])
- set this column as sort column by


Slicer[edit]

- Selection Behavior

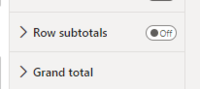
Matrix[edit]
- is neary the same as pivot
- https://www.goodly.co.in/create-pivot-table-in-power-bi/
- grand total and subtotals

Mulit-Row Card[edit]
- Title On/Off: caption of multi-row card on top
- Visual Data -> Fields -> Right Click -> Rename for this visual: text below number
- Visual Data -> Category Label On/Off: show text below number
- Visual Data -> Category Label: format of text below number
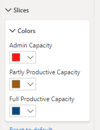
Pie Chart[edit]
- sequence of fields defines the position, starts at 00:00
- Format -> Visual -> Legend -> Position
- Format -> Visual -> Slices -> Colors

Single Card[edit]
- 'Collout value' -> Font: size of number
- 'Category label' on/off: text below number
- 'Title': text above number
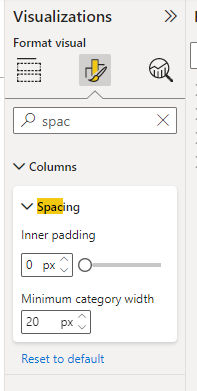
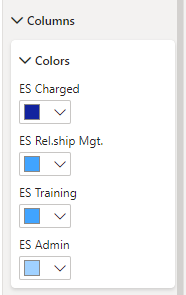
Stacked Bar Chart[edit]
- figures in bar by switching on 'data label'
- bar char width by spacing -> Inner Padding
- colors


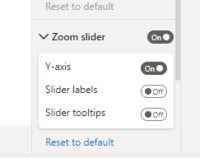
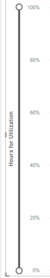
100% Stacked Column Chart[edit]
- zoom slider


Stacked Column Chart[edit]
- show 0 values
Table[edit]
Show Duplicates[edit]

Projects[edit]
ES KPI Reporting[edit]
- Table for Activity Sorting: Report View -> Enter Data -> ... and edit it via these steps
English/German[edit]
| Slicer | Datenschnitt |
| E1 | G1 |
| E2 | G2 |