MSPowerBI: Difference between revisions
| Line 80: | Line 80: | ||
* select dots [[File:PowerBI_0.JPG|400px]] | * select dots [[File:PowerBI_0.JPG|400px]] | ||
* select export data [[File:PowerBI_1.JPG|400px]] | * select export data [[File:PowerBI_1.JPG|400px]] | ||
===Relationsships=== | |||
====Change Default Summarization==== | |||
* [[File:PowerBI_18.PNG|600px]] | |||
Revision as of 22:06, 2 March 2022
Information
- extension for local saves is *.pbix
Concepts
- There are three different options on how your data should be treated: Import, DirectQuery, or Live Connection. This section will focus specifically on the Import option.
Power Query
Eine Power Query benutzerdefinierte Funktion ist eine Zuordnung aus einem Satz von Eingabewerten zu einem einzelnen Ausgabewert und wird aus nativen M-Funktionen und -Operatoren erstellt.
M Language
M ist eine funktionale Sprache:
- Der gesamte Code ist in Schritte unterteilt, die alle innerhalb eines Let-in-Statements definiert sind
- Jeder Schritt hat einen Namen, z. B. Quelle, oder auch #"Geänderter Typ"
- Schritte bauen zumeist (aber nicht zwangsläufig) aufeinander auf. Daher sieht man es häufig, dass der Name eines Schrittes im darauffolgenden Schritt innerhalb der Funktionen benutzt wird
- Derjenige Schritt, der nach dem in benannt ist (letzte Zeile im Skript), stellt das Ergebnis der gesamten Abfrage da. Das Ergebnis dieses Schrittes wird dem Nutzer – zumeist, aber nicht notwendigerweise – als Tabelle zurückgegeben.
Relationsships
Import aspects are:
- Auto-detected relationships
- There may be only one active relationship between two tables
- There may be an unlimited number of in-active relationships between two tables
- Relationships may only be built on a single column, not multiple columns
- Relationships automatically filter from the one side of the relationship to the many side Relationships cannot be built directly between tables that have a many-to-many relationship
- Cross-Filtering means a filter from a 1-to-many and many-to-1 relationship like filter on one dimension table to filter another dimension table via a fact table
The arrows defines the direction of filtering:
Views
- Report View (Berichtsansicht)
- Data View (Datenansicht)
- Relationship View (Beziehungsansicht)

Ressources
Operation
Import Data from Excel
General Information
Power Query Editor always works with a preview of the data, to make the development process fast. When you load the data in Power BI, transformations will be applied on the entire dataset. Hence errors might have not been identified before the full import of data.
Steps
Define Import
- select import and file
- select transform (not load)
Delete Rows e.g. Header
- delete rows above headers (e.g. filter sums) by
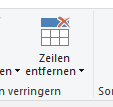
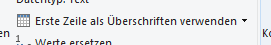
- set first row as header line by


Delete Columns
- delete columns not needed by right click -> delete
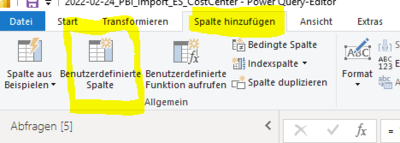
Add Columns
- see https://docs.microsoft.com/de-de/power-bi/transform-model/desktop-tutorial-create-calculated-columns
- example

= Table.AddColumn(#"Geänderter Typ", "Charge Fact", each if Value.Is([#"Chargeability (FTE)#(lf)"], type number) then [#"Chargeability (FTE)#(lf)"] else 1)
= Table.AddColumn(#"Geänderter Typ2", "Activity Type", each if [#"Partner-PSP-Element"] = "9914.P10048.004" then "ES Admin" else if [#"Partner-PSP-Element"] = "9914.P10048.005" then "ES Training" else if [#"Partner-PSP-Element"] = "9914.P10048.006" then "ES Relationship Management" else "tbd")
Delete Rows
- filter specific value (click to right down arrow in the column header and define the filter)
N charactors from left
- next step delete the rows to the right
- rename column to the original name (w/o .1 suffix)

Adjust Query

Not summing up a column like personnel number

Error Handling
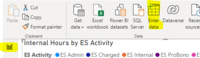
Export Data to Excel
- move or right click in header
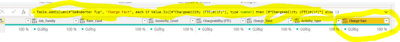
- select dots
- select export data


Relationsships
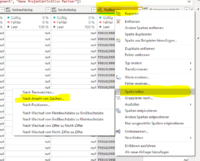
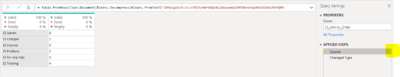
Change Default Summarization

Visuals
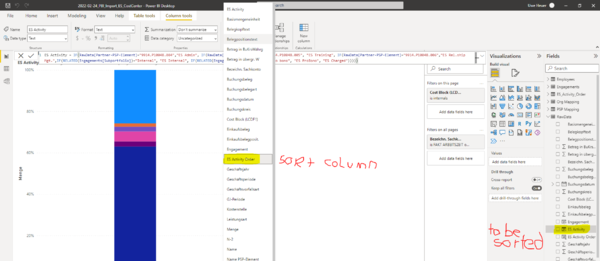
Sorting according to Values
- Enter Data and give the table a name
- if needed edit the data by
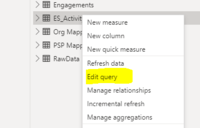 which opens Power Query
 - select
- if needed edit the data by
- Create Relationship
- Create new Sort Column with e.g.


ES Activity Order = RELATED(ES_Activity_Order[ES Activity Order])
- set this column as sort column by

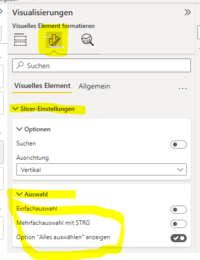
Slicer

- Selection Behavior

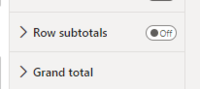
Matrix
- is neary the same as pivot
- https://www.goodly.co.in/create-pivot-table-in-power-bi/
- grand total and subtotals

Stacked Bar Chart
- figures in bar by switching on 'data label'
English/German
| Slicer | Datenschnitt |
| E1 | G1 |
| E2 | G2 |